Table of Contents
Company and Finances
The overview over the company is one of the most important aspects for players that do not play in sandbox mode. The company window can be opened by clicking on the account balance in the bottom left corner or by selecting the company headquarters building on the map. The window consists of six different tabs:
- Finances - Table gives an overview on revenue and expenditure over the recent time.
- Finances - Charts shows a diagram of revenue and expenditure.
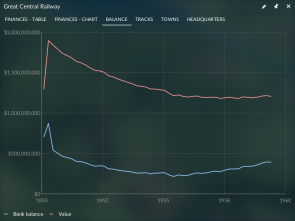
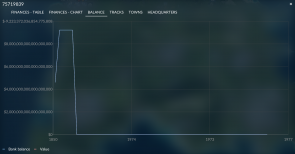
- Balance shows a diagram of the company’s bank balance and value.
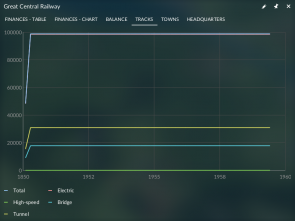
- Tracks shows a diagram of total track lengths.
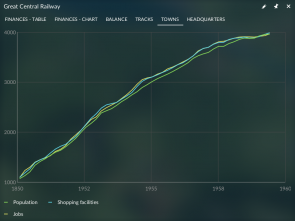
- Towns shows a diagram of key figures for towns.
- Headquarters shows the details of the company score. These are statistical aspects like the numbers of vehicles.
To rename the company, press the ![]() button in the top right corner of the company window.
button in the top right corner of the company window.
Finances
Table
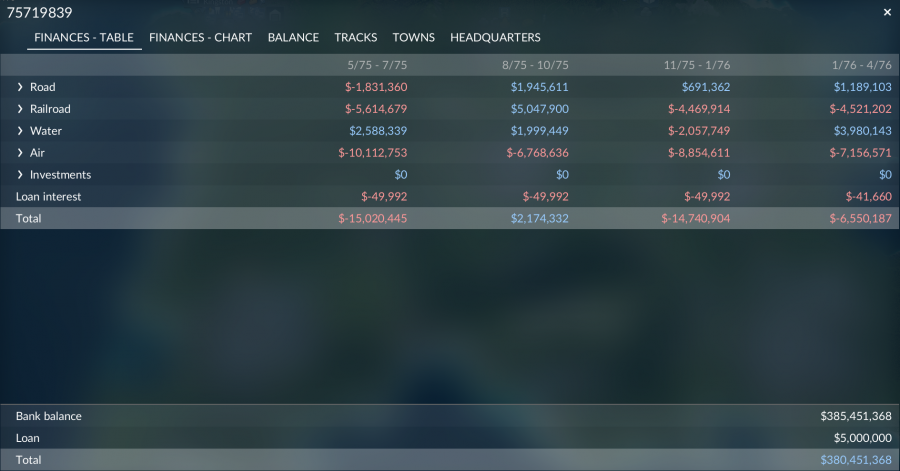
Select the FINANCES - TABLE tab to show the finances table.
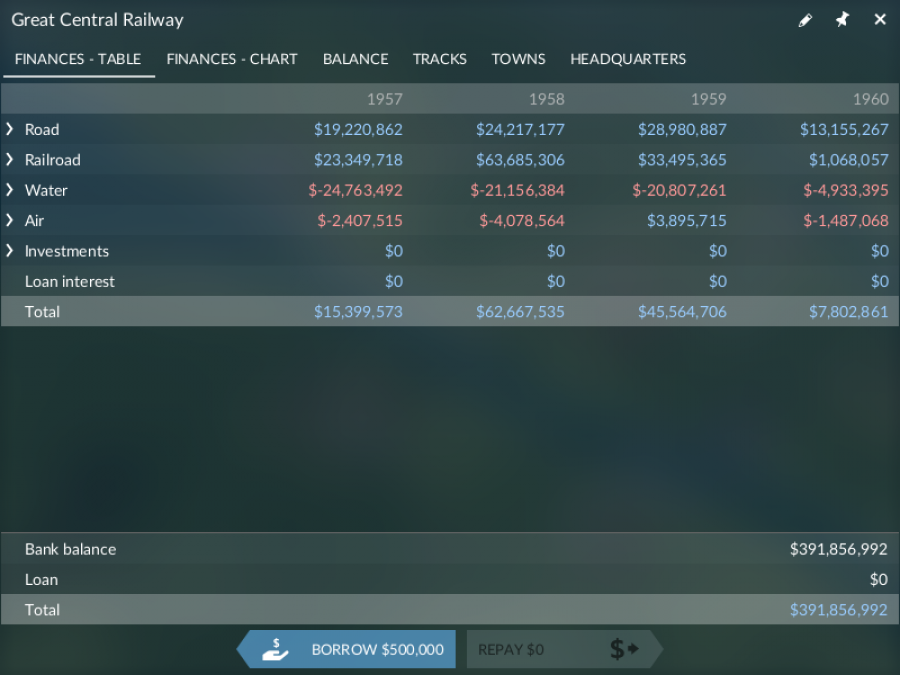
The finances table shows every aspect of income and costs grouped by topics. All the figures are listed for the current running interval (a year with normal date progress speed) as well as for the three previous intervals.
The table contains the following figures:
- Road contains all regular costs and incomes related to road vehicles.
- Tickets is the income from transported passengers and cargo items with busses, trams and trucks.
- Maintenance vehicles are the costs for maintaining the road vehicles to reduce emissions.
- Maintenance roads are the costs for maintaining player owned street sections.
- Maintenance infrastructure are the costs for maintaining road stops, stations and depots.
- Railroad contains all regular costs and incomes related to rail traffic.
- Tickets is the income from transported passengers and cargo items with trains.
- Maintenance vehicles are the costs for maintaining the rail vehicles to reduce emissions.
- Maintenance tracks are the costs for maintaining the laid tracks.
- Maintenance infrastructure are the costs for maintaining stations, signals and depots.
- Water contains all regular costs and incomes related to transportation on water.
- Tickets is the income from transported passengers and cargo items with ships.
- Maintenance vehicles are the costs for maintaining the ships to reduce emissions.
- Maintenance infrastructure are the costs for maintaining harbors and shipyards.
- Air contains all regular costs and incomes related to transportation with aircraft.
- Tickets is the income from transported passengers and cargo items with airplanes.
- Maintenance vehicles are the costs for maintaining the airplanes to reduce emissions.
- Maintenance infrastructure are the costs for maintaining airports.
- Investments contains all one time costs that originate from construction works or purchase of new vehicles.
- Vehicles are the costs for new vehicles of any type.
- Roads are the costs for construction, upgrade and replacement of roads.
- Tracks are the costs for construction, upgrade and replacement of tracks.
- Infrastructure are the costs for any other construction like stations, headquarter buildings etc.
- Loan interest are the costs that have to be paid monthly for the loan.
- Total is the sum of all the above parts
Below are three additional rows. The bank balance equals the number that is shown in the lower left corner of the screen. It's the amount of money that can be spent in the current situation. Loan is the amount of money that is lent and has to be paid back somewhen. Total is the final result excluding loans.
Chart
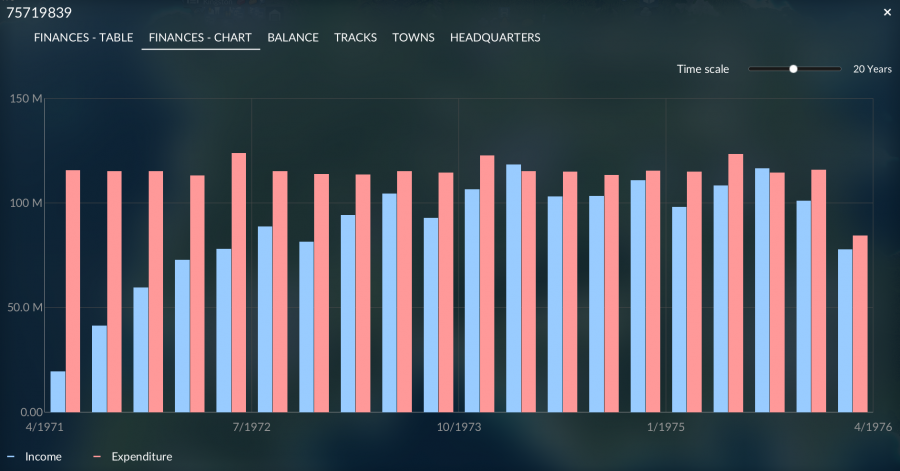
Select the FINANCES - CHART tab to show the finances chart.
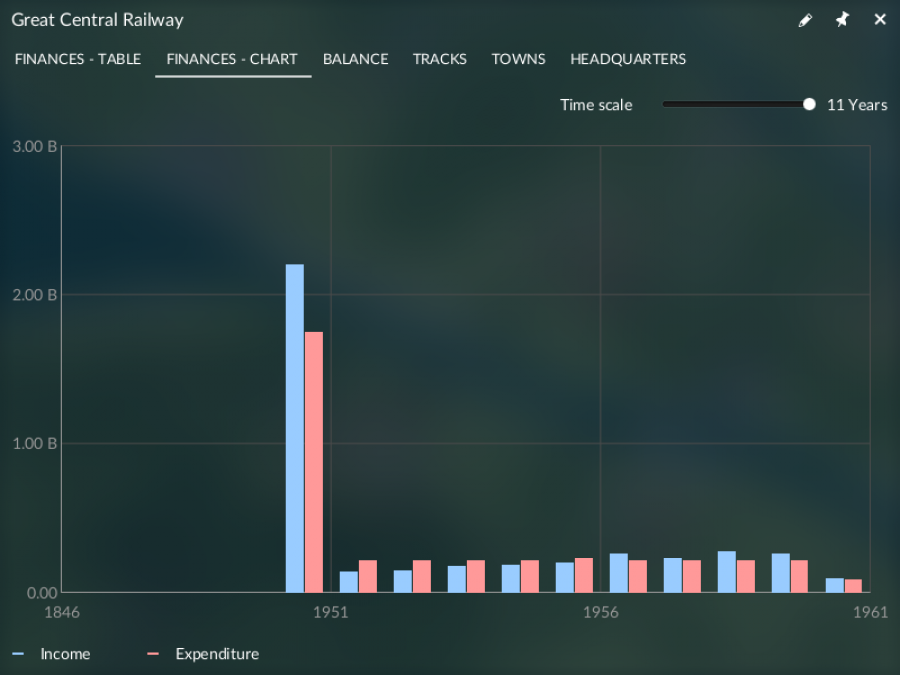
The chart is a graphical representation of all incomes and expenditures. The time interval shown can be selected with the slider in the top right area. By hovering over one of the columns, it's possible to see the exact values in a tooltip.
Loans
At the beginning of a new game, the company has a loan to start building. It is recommended to pay back the loan as there is a monthly interest rate. How high this rate is depends on the level of difficulty. Should more money be needed, it is possible to borrow more in $500.000 steps by clicking on ![]() BORROW $500.000 in the FINANCES - TABLE tab. To repay the loan, press on
BORROW $500.000 in the FINANCES - TABLE tab. To repay the loan, press on ![]() REPAY $500.000. The maximum loan depends on the current year.
REPAY $500.000. The maximum loan depends on the current year.
Charts
There are three different all time charts, one for the bank balance and company value, one for the track infrastructure and one for the town growth. Select the relevant tab to access them.
The company charts show the development of the game world over time and record the history since the company was founded. Hover over any point on the curves to display the exact values in a tooltip.
Balance
In the balance chart you can see the progression of the bank balance in light blue and the overall company value consisting of the bank balance and the value of infrastructure and vehicles in light red color.
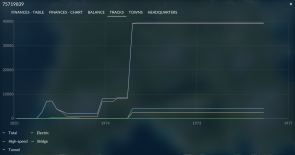
Tracks
This chart shows 5 different curves related to the rail track network:
- Total shows the total length of rail tracks in meters with light blue color.
- Electric shows the length of rail tracks with catenaries in meters with light red color.
- High-speed shows the length of high speed tracks in meters with green color.
- Bridge shows the total length of all bridges in meters with blue color.
- Tunnel shows the total length of all tunnels in meters with yellow color.
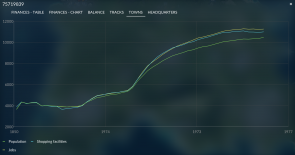
Towns
The town chart shows three curves related to the three districts of towns:
- Population is the overall number of residents in all residential buildings with green color.
- Shopping facilities covers the number of possibilities to shop in all commercial districts with blue color.
- Jobs is the sum of existing jobs in industrial districts all over the map with yellow color.
Headquarters
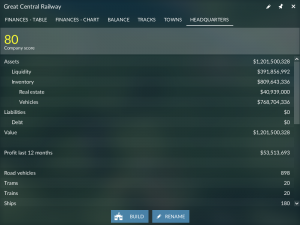
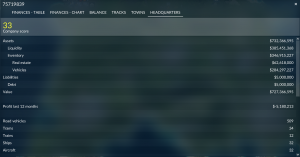
Additional non monetary statistics are provided in the HEADQUARTERS tab. The tab shows the figures in the form of a table. Most of the figures have some influence on the company score:
- 1 point for each started billion $ of company value
- 1 point for every completed 10 trains
- 1 point for every completed 100 busses or trucks
- 1 point for every completed 5 aircrafts
- 1 point for every completed 5 ships
- 1 point for every completed 20 trams
- 1 point for every year that the oldest vehicle is below 100 years
- 1 point for every 100 km/h that the fastest vehicle can travel
- 1 point for every 100 meters length of the longest vehicle
- 1 point for every completed 100 km of rail network
- 1 point for every completed 100 km of electrified rail network
- 1 point for every completed 10 km of bridges
- 1 point for every completed 10 km of tunnels
- 1 point for every completed 10 million $ of current annual profit
- 1 point for every completed 100.000 transported cargo units
- 1 point for every completed 100.000 transported passengers
Headquarter Building

It is possible to build (and relocate) the company headquarter building by pressing the button at the bottom of the HEADQUARTERS tab. The building grows according to the score of the company.